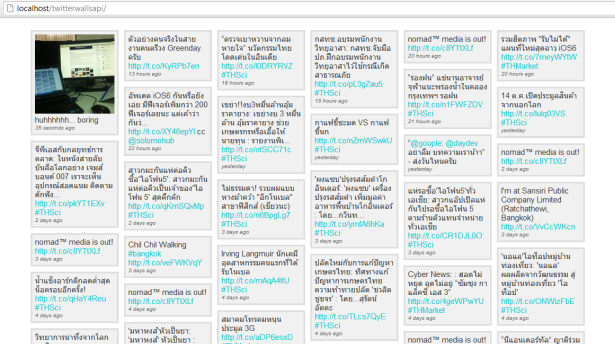
วิธีการเขียนโปรแกรมร่วมกับ Google Maps JavaScript API v3 ที่เน้นในการ Render Maps หรือแผนที่ของเราให้สวยงามโดยการทำงานเน้นที่ Javascript และ Google Maps API
ตัวอย่างจากบทความที่แล้วจะเป็น Static Maps API V2 ที่เน้นเรื่องของกราฟิกรูปภาพที่โต้ตอบอะไรไม่ได้มากในรอบนี้จะมีการ Advance ขึ้นมาหน่อยนั่นคือการใช้งานร่วมกับ Google Maps JavaScript API v3 ซึ่งจริงๆ Source Code ส่วนมากใน Hepl Document ของ Google Maps JavaScript API v3 ก็อธิบายได้ชัดเจนอยู่แล้วครับ แต่เราลองเอามาประยุกต์ใช้กันหน่อย
โดยการรวมเทคนิครอบนี้ จะเน้นตัวอย่างที่ใช้กันบ่อย
วิธีการ Render นั้นไม่ยากครับ แค่ใส่ Javascript ตามนี้ลงไป
Simple Map
ลองทดสอบรันเจ้าไฟล์ HTML ตัวนี้ดูก็จะได้ตามนี้ครับ
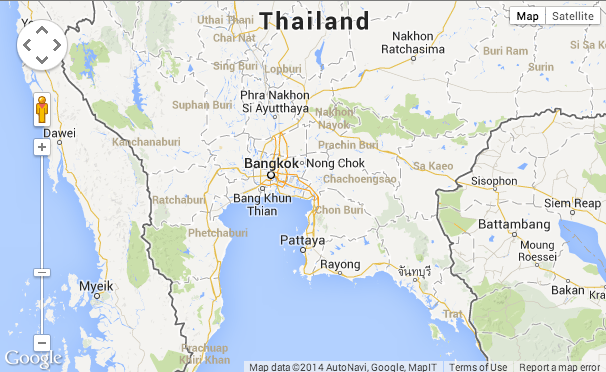
ตัวแปรที่เราจะยุ่งด้วยบ่อยๆ คือ ตำแหน่ง Lat และ Lon ที่เราหาได้จาก Google Maps บริเวณ URL Bars ของ Browser ของเราครับ
center: new google.maps.LatLng(13.7461689,100.5309576)
หาได้จาก

แผนที่ของเราแทรก tile coordinates ลงไปได้เพื่อระบุว่า พิกัดนี้คืออะไร โดยการใส่ code ตามนี้ครับ
Showing pixel and tile coordinates
ลองทดสอบรันดูครับ
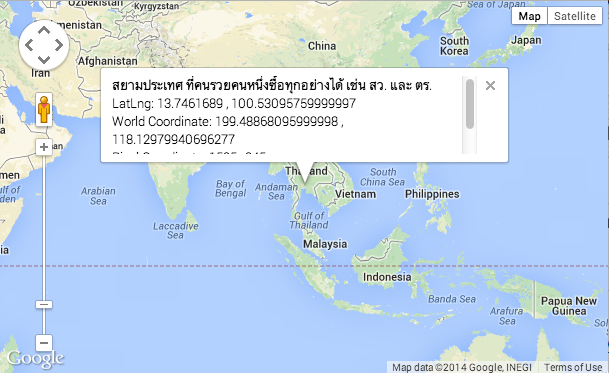
จะเห็นว่ามีฟังก์ชันบางตัวกำหนด พิกัดไว้คือ
var thailand = new google.maps.LatLng(13.7461689,100.5309576);
และมีการเรียกใช้ Coordinates ดังนี้
function createInfoWindowContent() {
  var numTiles = 1 << map.getZoom();
  var projection = new MercatorProjection();
  var worldCoordinate = projection.fromLatLngToPoint(thailand);
  var pixelCoordinate = new google.maps.Point(
      worldCoordinate.x * numTiles,
      worldCoordinate.y * numTiles);
  var tileCoordinate = new google.maps.Point(
      Math.floor(pixelCoordinate.x / TILE_SIZE),
      Math.floor(pixelCoordinate.y / TILE_SIZE));

  return [
    'สยามประเทศ ที่คนรวยคนหนึ่งซื้อทุกอย่างได้ เช่น สว. และ ตร.',
    'LatLng: ' + thailand.lat() + ' , ' + thailand.lng(),
    'World Coordinate: ' + worldCoordinate.x + ' , ' +
      worldCoordinate.y,
    'Pixel Coordinate: ' + Math.floor(pixelCoordinate.x) + ' , ' +
      Math.floor(pixelCoordinate.y),
    'Tile Coordinate: ' + tileCoordinate.x + ' , ' +
      tileCoordinate.y + ' at Zoom Level: ' + map.getZoom()
  ].join('
');
}
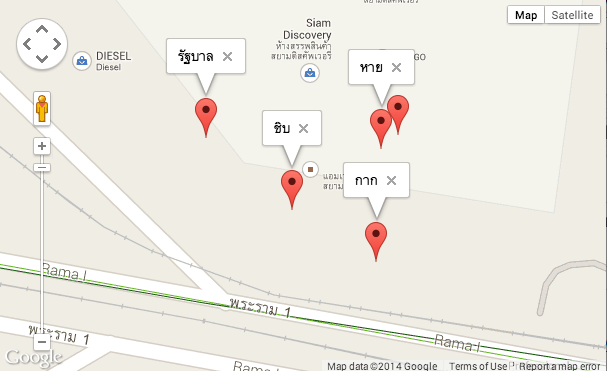
ต่อมาเป็นเรื่องของการใช้งาน Click Event เมื่อมีระบุพิกัด ตำแหน่งใจกลาง และตีกรอบด้วย พิกัด สี่เหลี่ยมเราสามารถทำให้ หมุดที่ปรากฏนั้น คลิกแล้วปรากฏข้อความขึ้นมาโชว์ได้ครับ
Using closures in event listeners
วิเคราะห์ส่วนนี้
function attachSecretMessage(marker, num) {
  var message = ['รัฐบาล', 'กาก', 'ชิบ', 'หาย', 'เนอะ!'];
  var infowindow = new google.maps.InfoWindow({
    content: message[num]
  });

  google.maps.event.addListener(marker, 'click', function() {
    infowindow.open(marker.get('map'), marker);
  });
}
เป็นการ ระบุว่าตำแหน่งไหน แสดงผลคำว่าอะไร
ลองทดสอบดู
มาดูว่า ประเทศไทย เขตไหนหนาว หรือร้อนแค่ไหน สภาพภูมิอากาศเป็นยังไงบ้างก็ ลองเขียน Code ตามนี้ครับ
Weather layer
ส่วนนี้เปลี่ยนได้นะครับ
var weatherLayer = new google.maps.weather.WeatherLayer({
 temperatureUnits: google.maps.weather.TemperatureUnit.FAHRENHEIT
 });
 weatherLayer.setMap(map);
เปลี่ยนแปลงเป็น
var weatherLayer = new google.maps.weather.WeatherLayer({
 temperatureUnits: google.maps.weather.TemperatureUnit.CELSIUS
 });
 weatherLayer.setMap(map);
แสดงผลกันหน่อย แบบ Fahrenheit และ Celsius
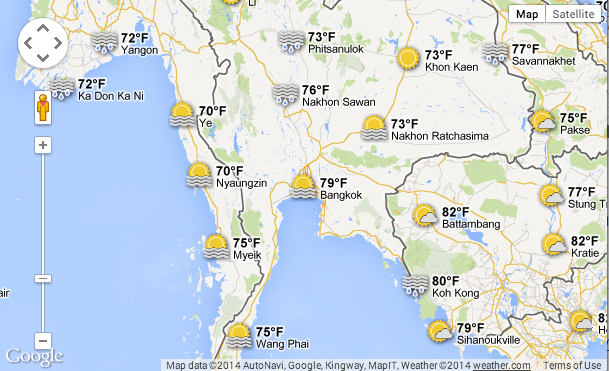
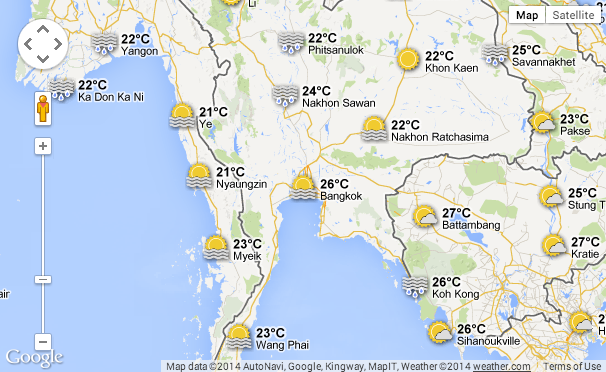
อันไหนเวิร์คก็จัดไปนะครับ
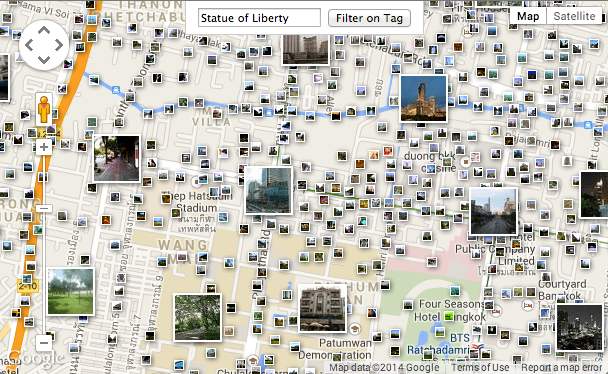
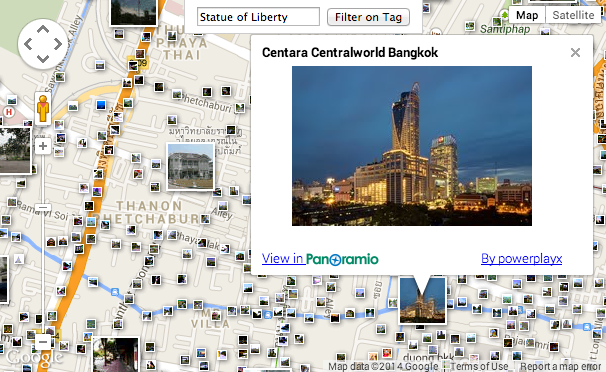
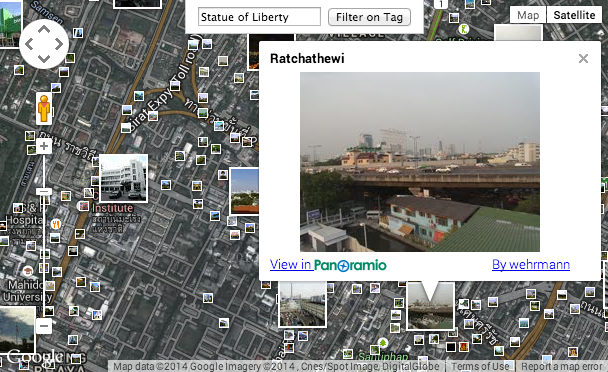
ตัวสุดท้ายก่อนแล้วกันคือการแทรกภาพ ของ Picasa และ Image Sharing ตัวอื่นๆ ให้มาปรากฏบน Map ของเราตาม tag ครับ
Restricting photos by tag (Panoramio layer)
ไฟล์ทั้งหมดนี้ เอาไปแกะกันเองแล้วกันมี Source Code ให้ ถือว่านี่เป็น Tutorial ที่กวนตีน และ ขี้เกียจที่สุดแล้วกันนะครับ เขี่ยๆ ส่งๆ ให้อ่านจริงๆ เพราะงานเยอะ
ลองทดสอบดูนะครับ

Download Source Code: https://www.daydev.com/download/GoogleMapsV3.zip
ขอบคุณ https://developers.google.com/maps/documentation/javascript/


